Recipe 7: Synchronizing with the World
One of Egeria's key roles is to collect, process and distribute metadata with other applications and systems. In this recipe we will explore how to do this by working with Integration Connectors and a specific type of Egeria Open Metadata and Governance (OMAG) server called an Integration Daemon.
An integration daemon is long running agent configured to run one or more Integration Connectors, which are the actual bits of code that communicate with other systems. Integration connectors are technology-specific and are designed and implemented based on what the partner technology is capable of and the intention of the interaction. For example, an integration connector may both gather and distribute information of different types with a another system.
Egeria includes a number of integration connectors Connector Catalog. There are also well-defined coding patterns **Building Integration Connectors **to create new ones as there are always new technologies and systems that people want to integrate with.
In this recipe we will walk through these components and:
Startup and Investigate an Integration Daemon
Excercise an Integration Connector
Investigate the catalogued results
We will be building on previous recipes...so feel free to review them.
Concepts
Integration connectors communicate with other systems through the public interfaces they provide. Interfaces could be of any type, for example REST interfaces and Java APIs are quite common. To work with a given technology we may have multiple integration connectors that work together. Technical details on building integration connectors can be found at Building Integration Connectors.
In this recipe we will start with a simple file folder connector and show how we can use this to catalog files in a folder.
In a subsequent recipe we will Survey the contents of file folders so we can decide which we want to catalog. Surveying is the approach we use to explore an environment - so, for example, we would run a file folder survey to understand what kinds of files are in the folder, how big they are, and when the directory was last updated. Understanding these attributes can help us to determine if its worth spending more time and effort to analyze the content more deeply. Directed surveying over unknown, and potentially voluminous environments is key to finding relevant information in a scalable manner.
Ok, lets start by working with an integration daemon.
1. Investigate the Integration Daemon
There are several ways to configure and deploy Integration Connectors and Integration Daemons to satisfy different requirements. In this recipe we will continue down the easy path, making use of pre-configured servers and connectors. Way back, in Recipe 2, we worked through how to start the Egeria OMAG Server Platform with a simple, pre-configured OMAG Server (in that case it was the simple-metadata-store). For this recipe (and subsequent ones), we want to use more of Egeria's capabilities so we will need to update our configuration to enable the other pre-configured OMAG Servers. We won't use all of them in this recipe, but they will come into play down the road. The other, pre-configured servers are:
active-metadata-store - designed to support a persistent metadata store with history.
integration-daemon - an example of an integration daemon that supports integration connectors (the star of this recipe).
view-server - view-servers are the primary interface for User Interfaces (and the pyegeria python functions) to access Egeria capabilities in a secure and safe manner. We will be using them extensively.
engine-host - supports the execution of governance processes and actions - we will cover them further in the next recipe.
Each of these servers should be pre-configured in your Egeria distribution. To check, take a look in your Egeria distribution at the data folder in the platform directory. On my system, the path is:
~/egeria_sandbox/egeria-platform-5.1-SNAPSHOT-dist.gz/assembly/platform/data
In that directory is a folder called servers which contains a sub-directory for each configured server. You should see an entry for each of the servers listed above. If you don't, a copy of each configuration (and instructions in a README.md file) can be found in the sample-configs folder which on my system is at:
~/egeria_sandbox/egeria-platform-5.1-SNAPSHOT-dist.gz/assembly/opt/sample-configs
Ok, now as you recall from Recipe 2, we can automatically activate these servers when the Egeria platform starts by updating the application.properties file. Update the line that starts with:
startup.server.list
to be:
startup.server.list=active-metadata-store,engine-host,integration-daemon,view-server,simple-metadata-store
Now start (or restart) the Egeria Server Platform (don't forget to make sure that Kafka is running - see Recipe 4).
Many startup messages will be displayed in the console as the platform starts up. Whew! All the servers should now be running.
In the last recipe, we showed how to setup and use the pyegeria client. pyegeria has a number of pre-built example scripts that we can use to check on the environment. We can install these scripts as commands to make it easy to call them from a shell or terminal window on your machine. This is done using a handy free utility called pipx. Here is how to set it up.
Install pipx. Instructions for doing so can be found on their web site listed above.
Install pyegeria scripts with pipx:
pipx install pyegeria pipx ensurepath
Now lets see what commands we currently have (this list keeps expanding) by issuing
pipx list:

Now, finally, we can try some of the widgets. A good one to try first is
monitor_server_status.py. If you type that in on the command line then you should see something like this:
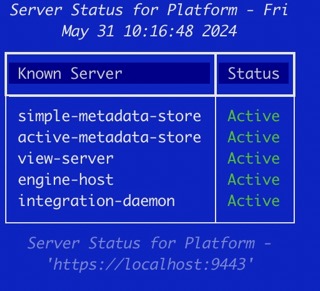
This simple but handy little widget tells us what servers are running on our Egeria OMAG Server Platform - and tells us the URL of the platform on the footer. It is a live widget, so if a server is stopped or a new one is started the status will be updated automatically. To quit the widget, you type ctrl-c (yes, I need to find a better way..). If you issue:
monitor_server_status.py -h
then the command line arguments are displayed - it is easy, for example, to change the platform you get the status for.
Ok, from this first widget we can see that we have an integration daemon (called integration-daemon) running. To see what integration connectors have been configured to run in the integration daemon we can use the widget called monitor_integ_daemon_status which will show us results like:

This tells us that we have five integration connectors already configured and running - just waiting for us to give it work. We can also see the last time each connector checked to see if there was work to perform and that by default, the minimum refresh interval is an hour. All of this is, of course, configurable.
But what started these integration connectors? Where did they come from? And, most importantly, how do we give it work to do? We'll start to answer these question in the next section.
2. Explore some simple examples
The pre-built active-metadata-store that we just started, automatically loads the CoreContentPack archive when it starts up. We can see this if we carefully watch the console where the OMAG Server Platform was started. This content pack includes numerous pre-built resources to simplify using Egeria for several common use cases. The first one we will explore allows us to drop files and folders into a directory being watched by Egeria. When we drop a file or folder, it will be automatically cataloged by an . Let's give it a try!
The watched folder is in the platform directory (which is also the working directory) and is called sample-data. Check that you have that folder. If not, go ahead and create it. In my environment, the folder is at:
~/egeria_sandbox/egeria-platform-4.4-SNAPSHOT-dist.gz/assembly/platform/sample-data
Now, open up a couple of terminal windows. One should show the console output from our Egeria Process on port 9443. Using the other terminal window (or perhaps a tool), copy a file (your choice) into the sample-data folder (create one first if yours is missing) and watch what happens in the Egeria console window. You should see the resources (files) that you dropped being automatically picked up by the FilesCataloguer integration connector. This connector then creates a new catalog entry for the resource. On my machine I copied in som files including (pdr-log.png) which Egeria immediately cataloged, displaying this snippet in the console:
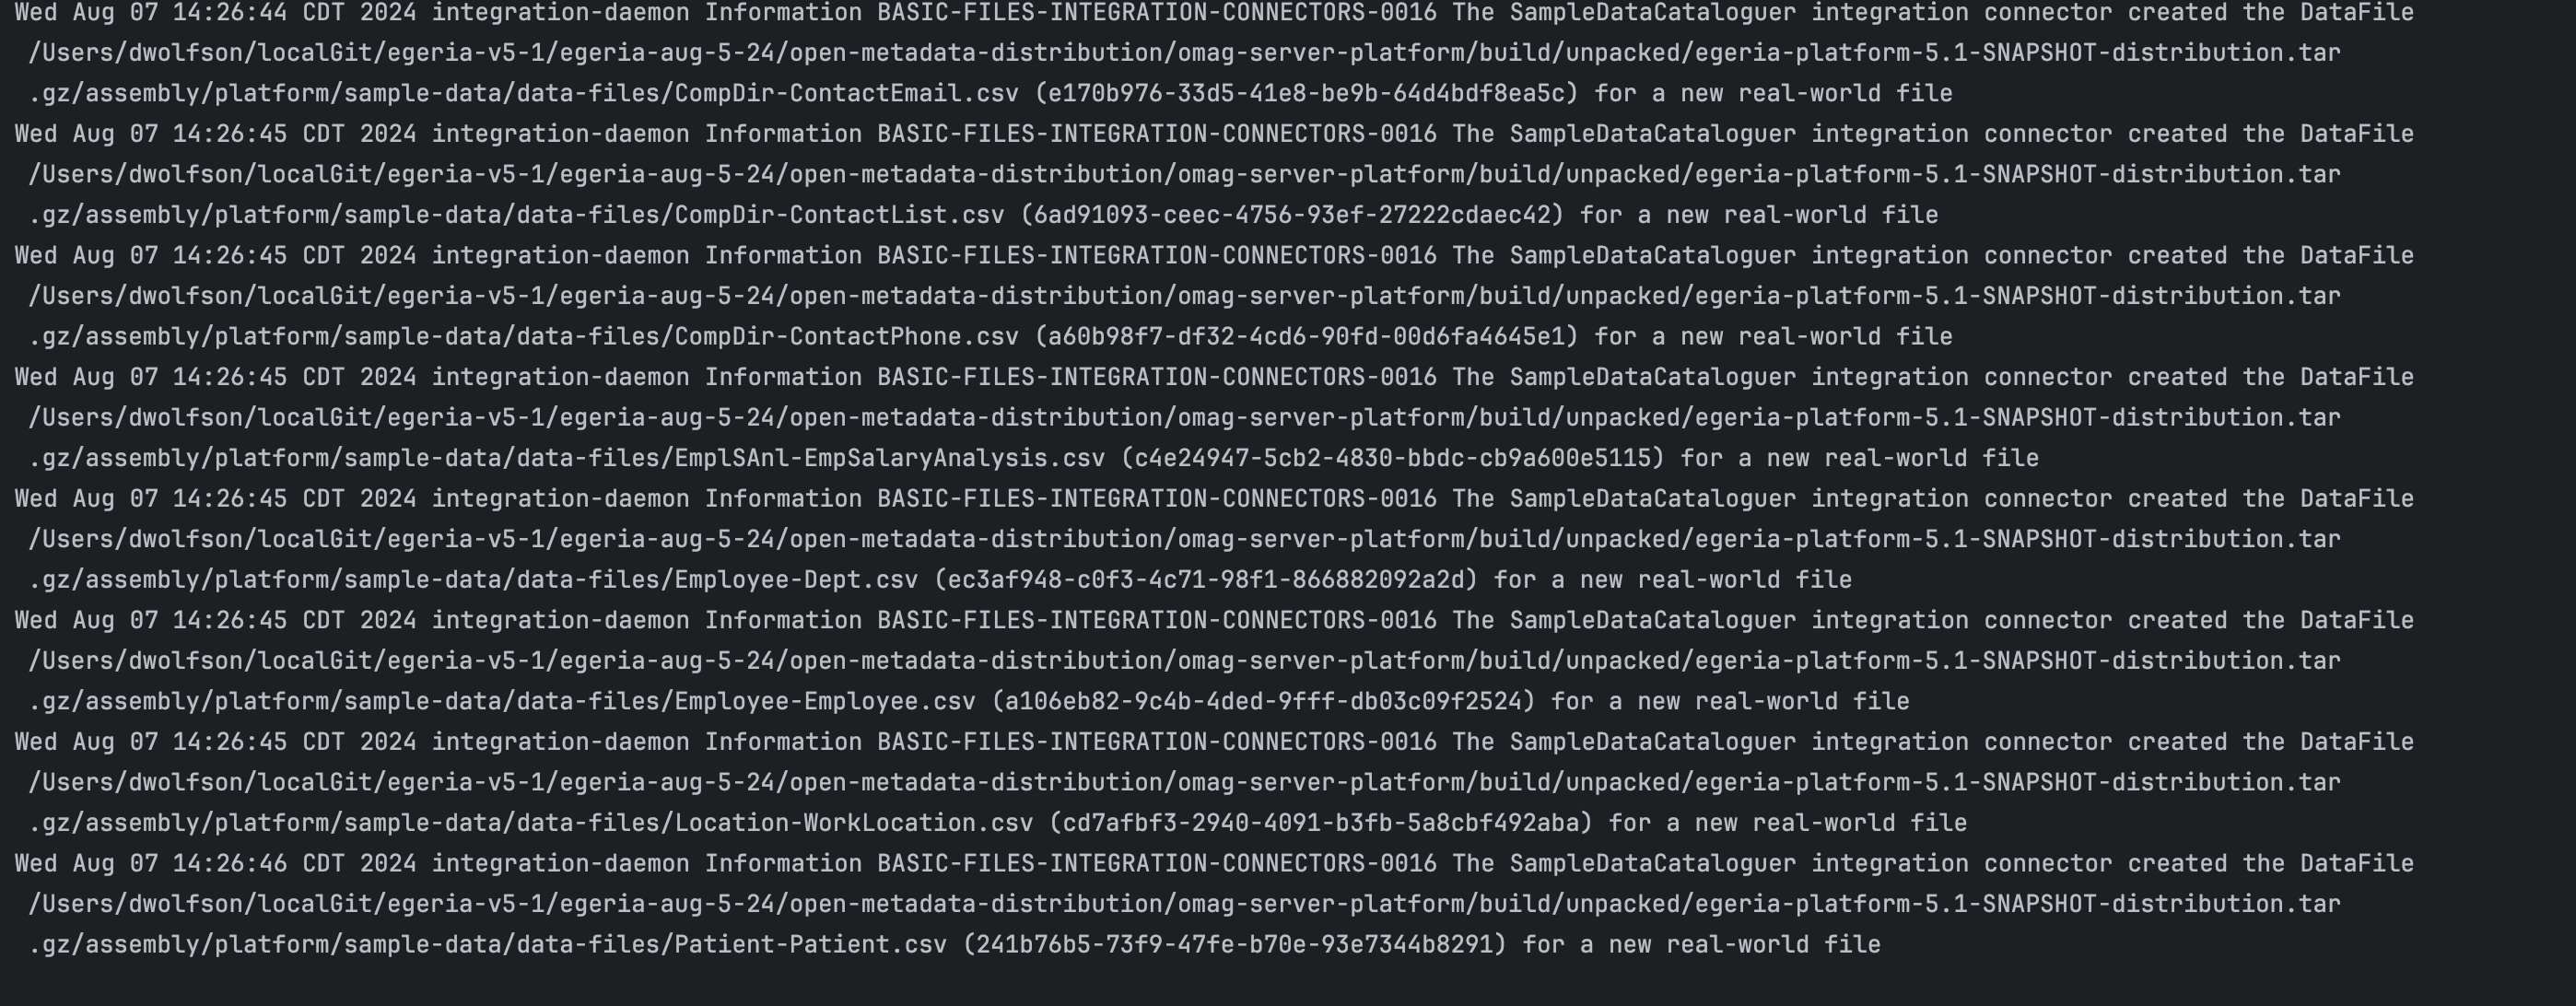
Importantly, we see that Egeria assigned a globally unique identifier (GUID) to the files it cataloged - for instance e170b976-33d5-41e8-be9b-64d4bdf8ea5c - is the asset guid for CompDir=ContactEmail.csv. One of the ways we can find this asset in the catalog later on is to issue a request to retrieve information about the asset associated with a specific GUID. We will explore some of these techniques in section 3.
There is a folder of additional sample data in the opt directory that is a peer to the platform directory. There you will find a variety of different files you can drop in to the platform/sample-data folder - either individually or as an entire folder. Give it a try ...
There are a number of ways to configure and start integration connectors - including the automated-curation-omvs python module that is part of the pyegeria python client. We will cover this module in the next few recipes. In the meantime, lets explore asset types and assets a bit further.
3. Exploring Further
Let's start by looking up one of the files that we just loaded. We can do this using another of the widgets we've been playing with. To find information about an Egeria asset from its GUID we can use:
get_guid_info, and enter one of the file or folder guids from your console.
This returns a lot of raw information about the asset that we just cataloged here is the top portion of the output on my terminal:
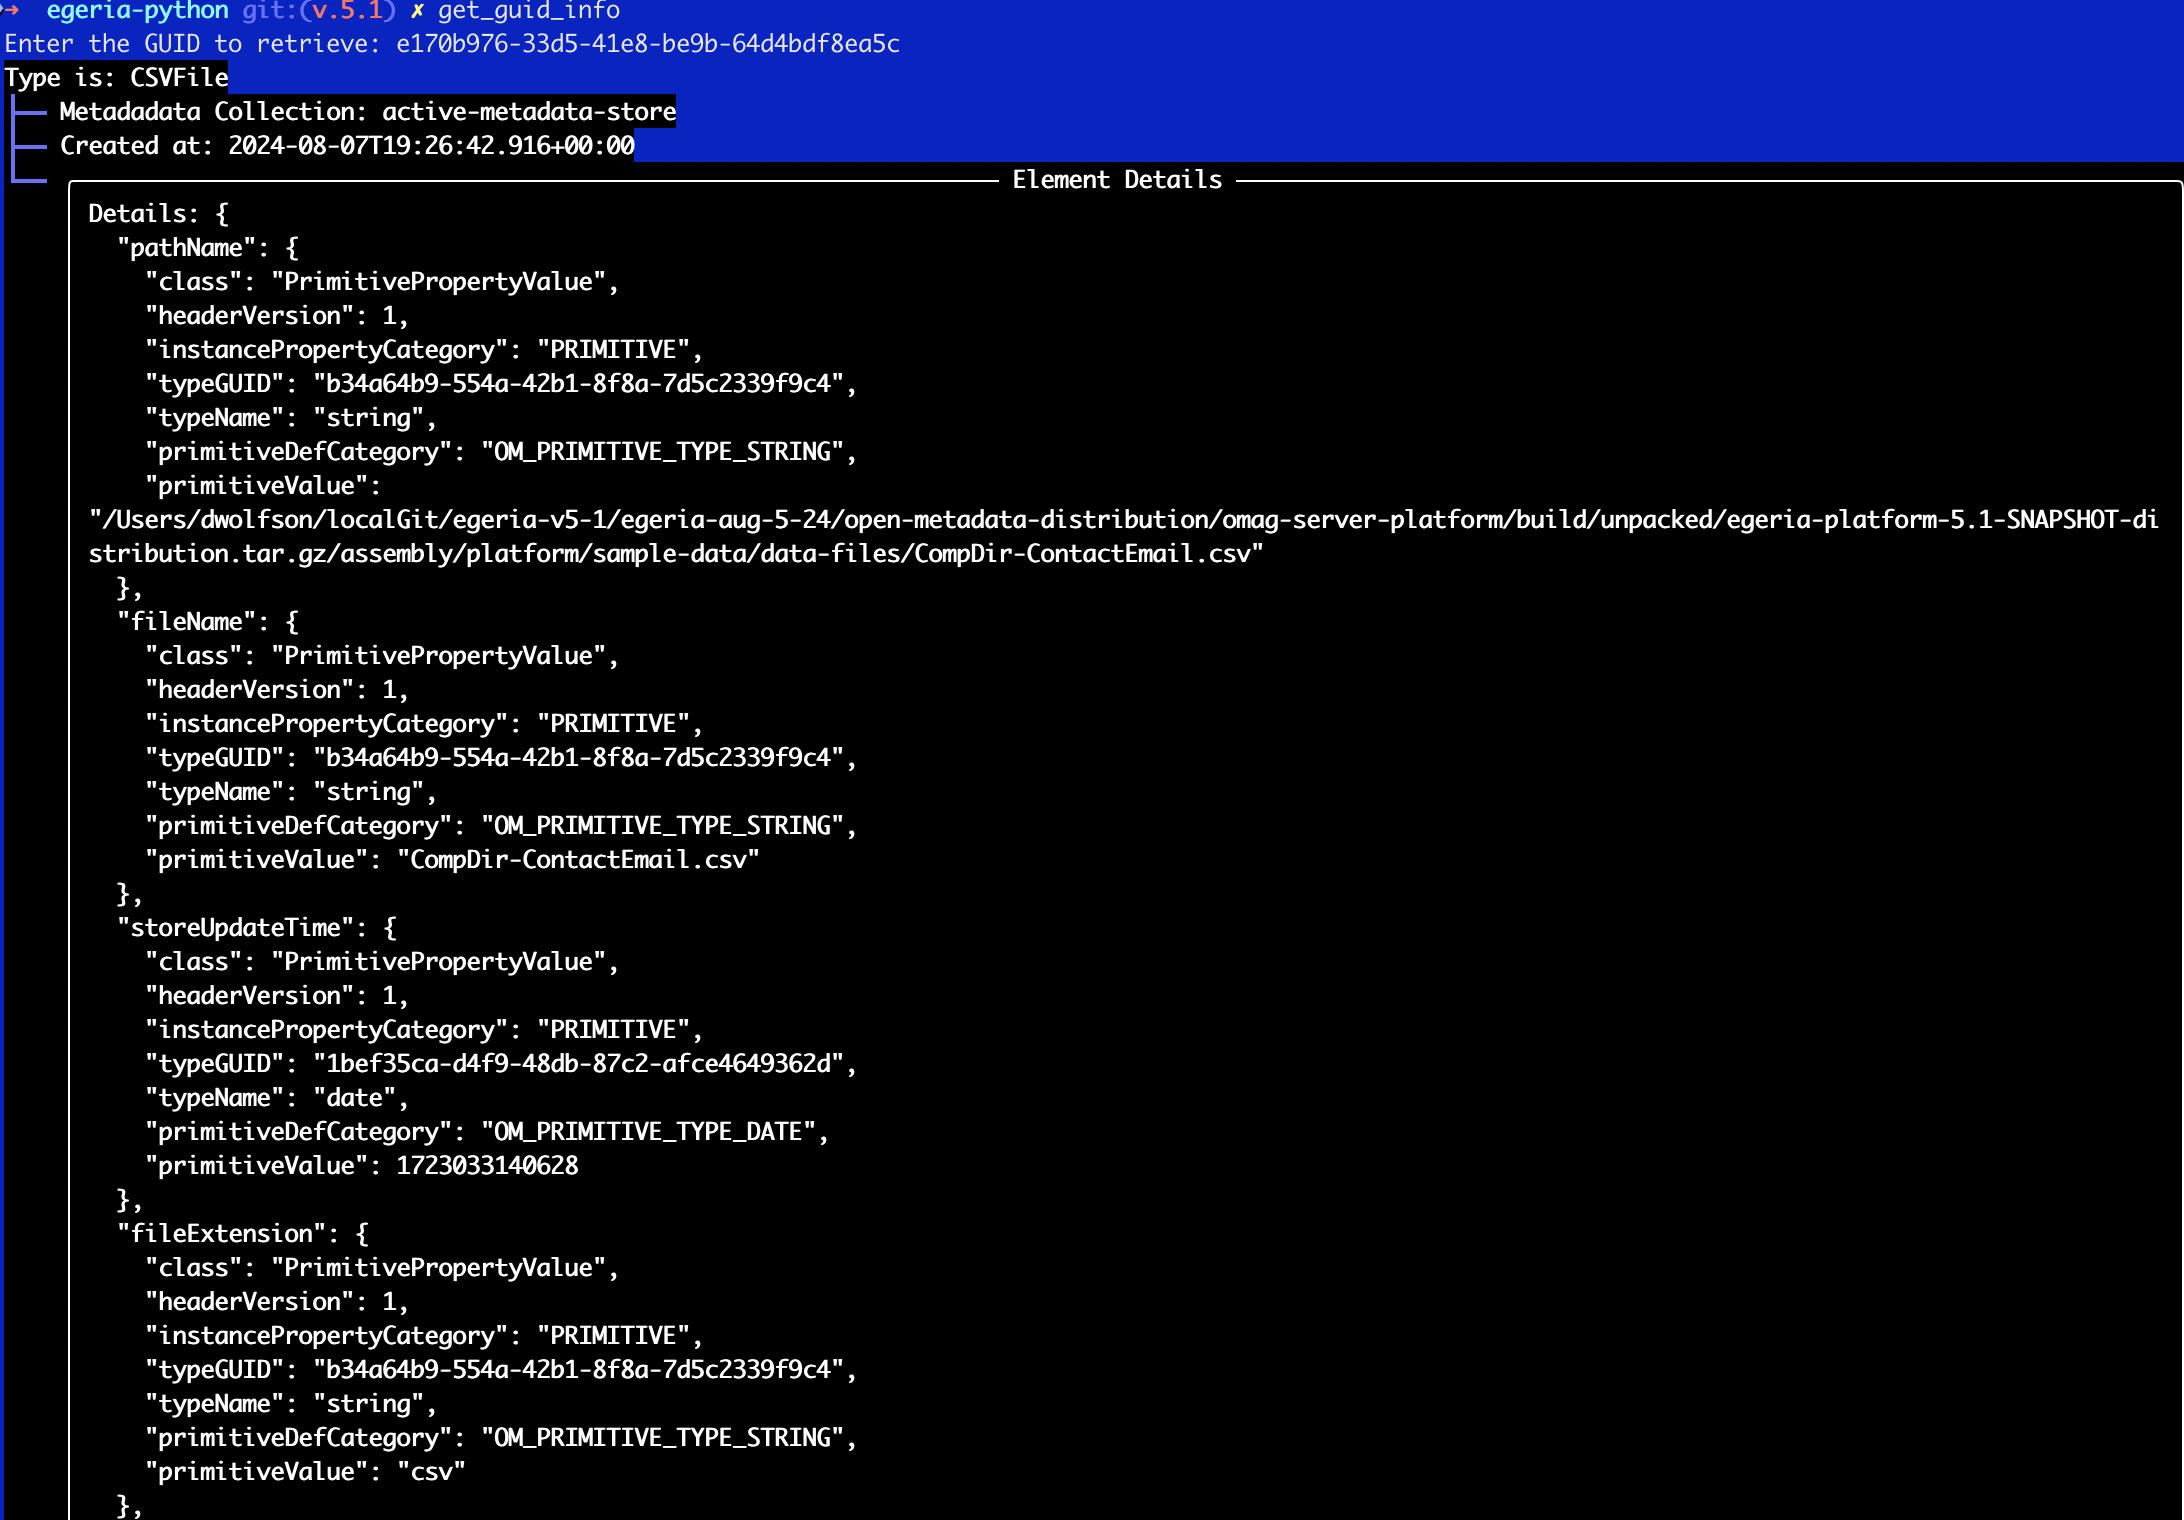
This shows that Egeria recognized the file as a CSV and we can see all the different things that Egeria recorded about the file. But it can be a bit hard to decipher the JSON output. We will spend more time on assets in a future recipe.
Stepping back, let's look at some of the integration connectors that Egeria has available out of the box. Connectors are documented here Connector Catalog; many are pre-configured in the core content pack (CoreContentPack.omarchive) to use. We can investigate this content pack with a couple of the Python widgets (these widgets will continue to evolve and improve). For instance, from the same terminal window we were using above, if you type:
get_tech_details
and take the default prompt (PostgreSQL Server) it will return:
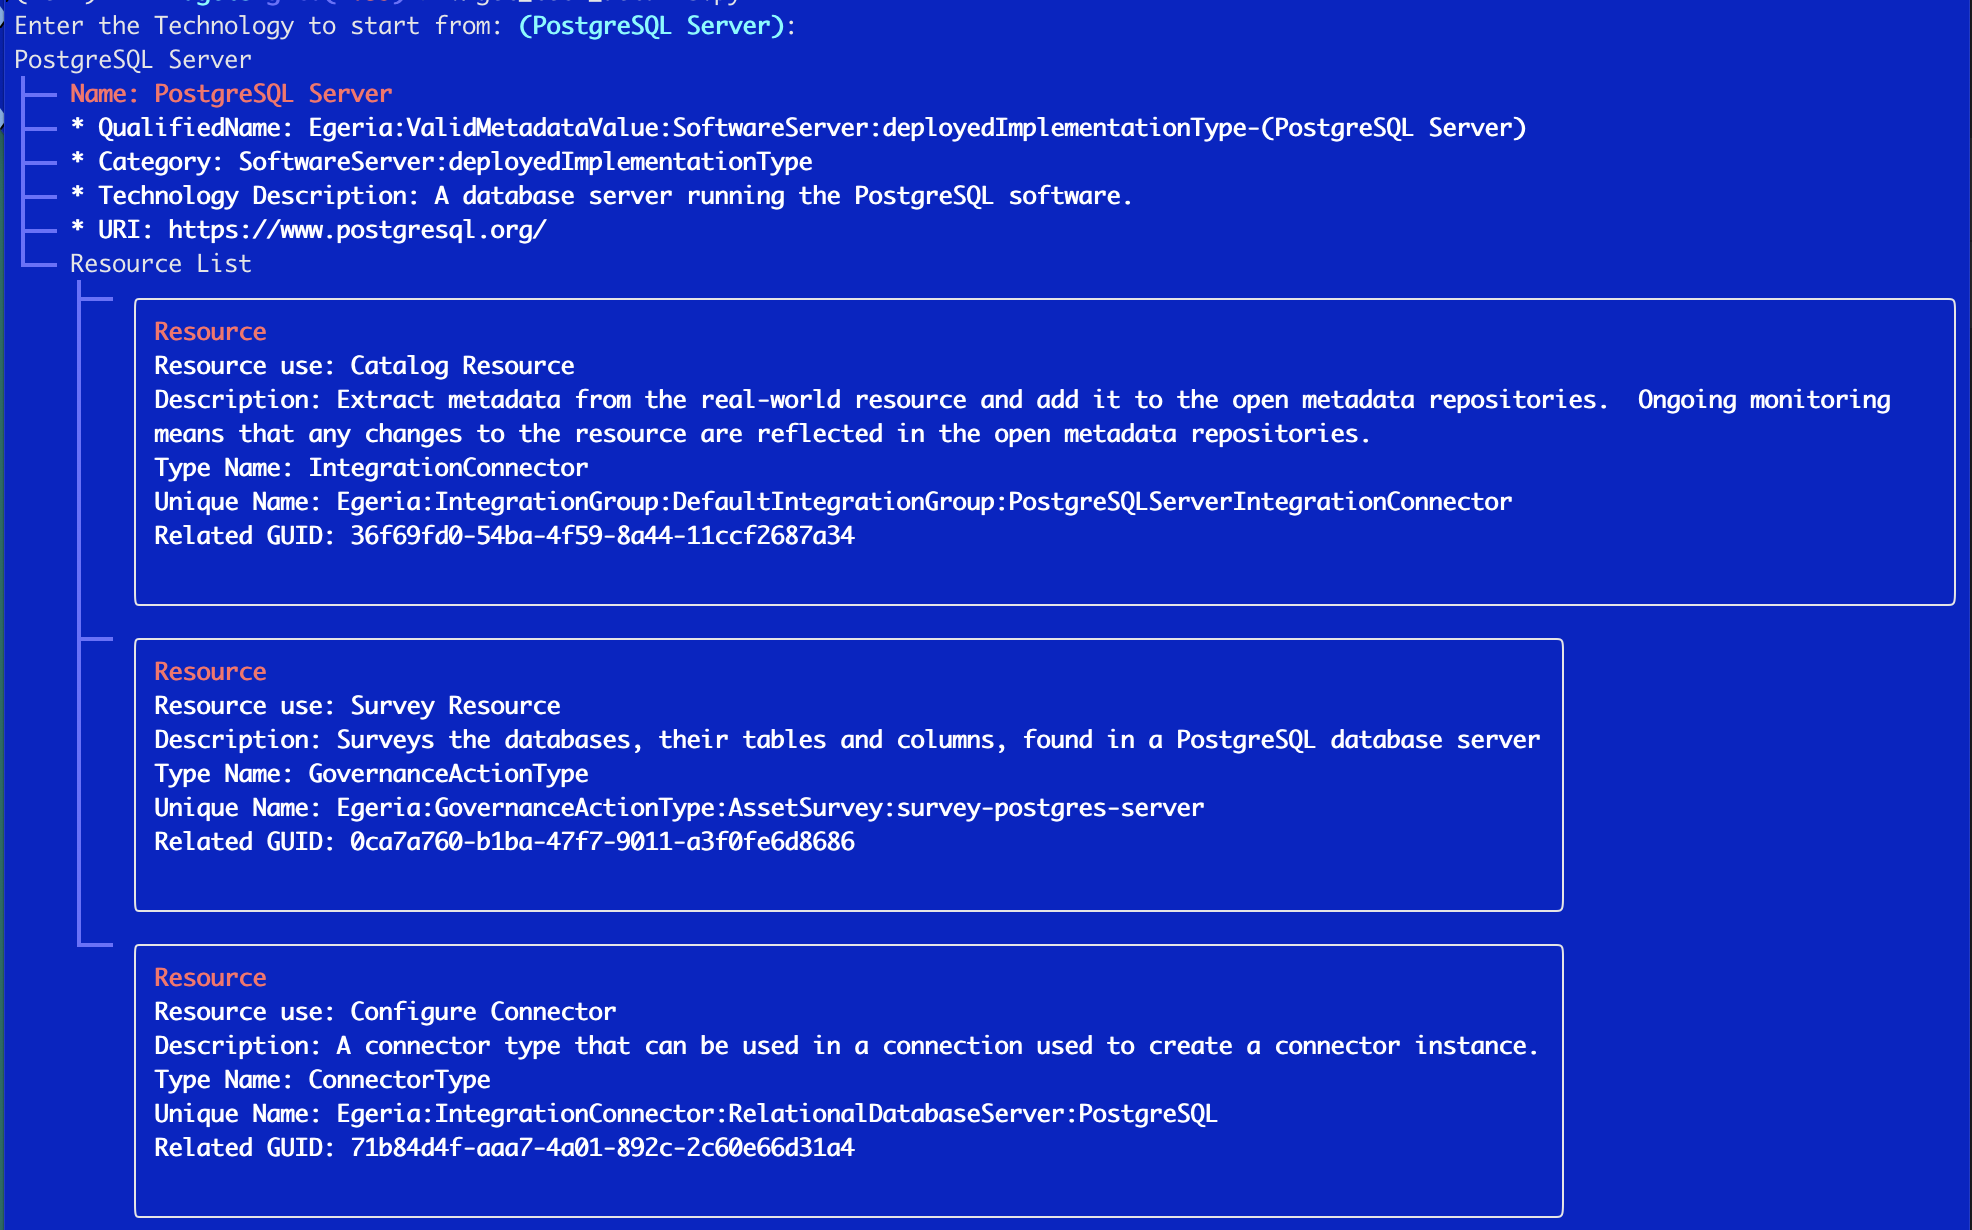
This tells us that if we want to catalog postgres server we can use indicated IntegrationConnector and if we want to survey a postgres server we can use the indicated GovernanceActionType. This information is helpful for us when we want to issue API calls to Egeria. We have been working to simplify this even further by implementing more specific helper APIs in both the HTTP APIs as well as pyegeria for some of the most common resources. The next recipe will describe how they can be used.
We can explore the CoreContentPack further using the interactive explorer at Egeria 5.1 Core Content Pack Interactive Exporer. This interactive explorer has a wealth of information and could in itself be the subject of one or more blogs.
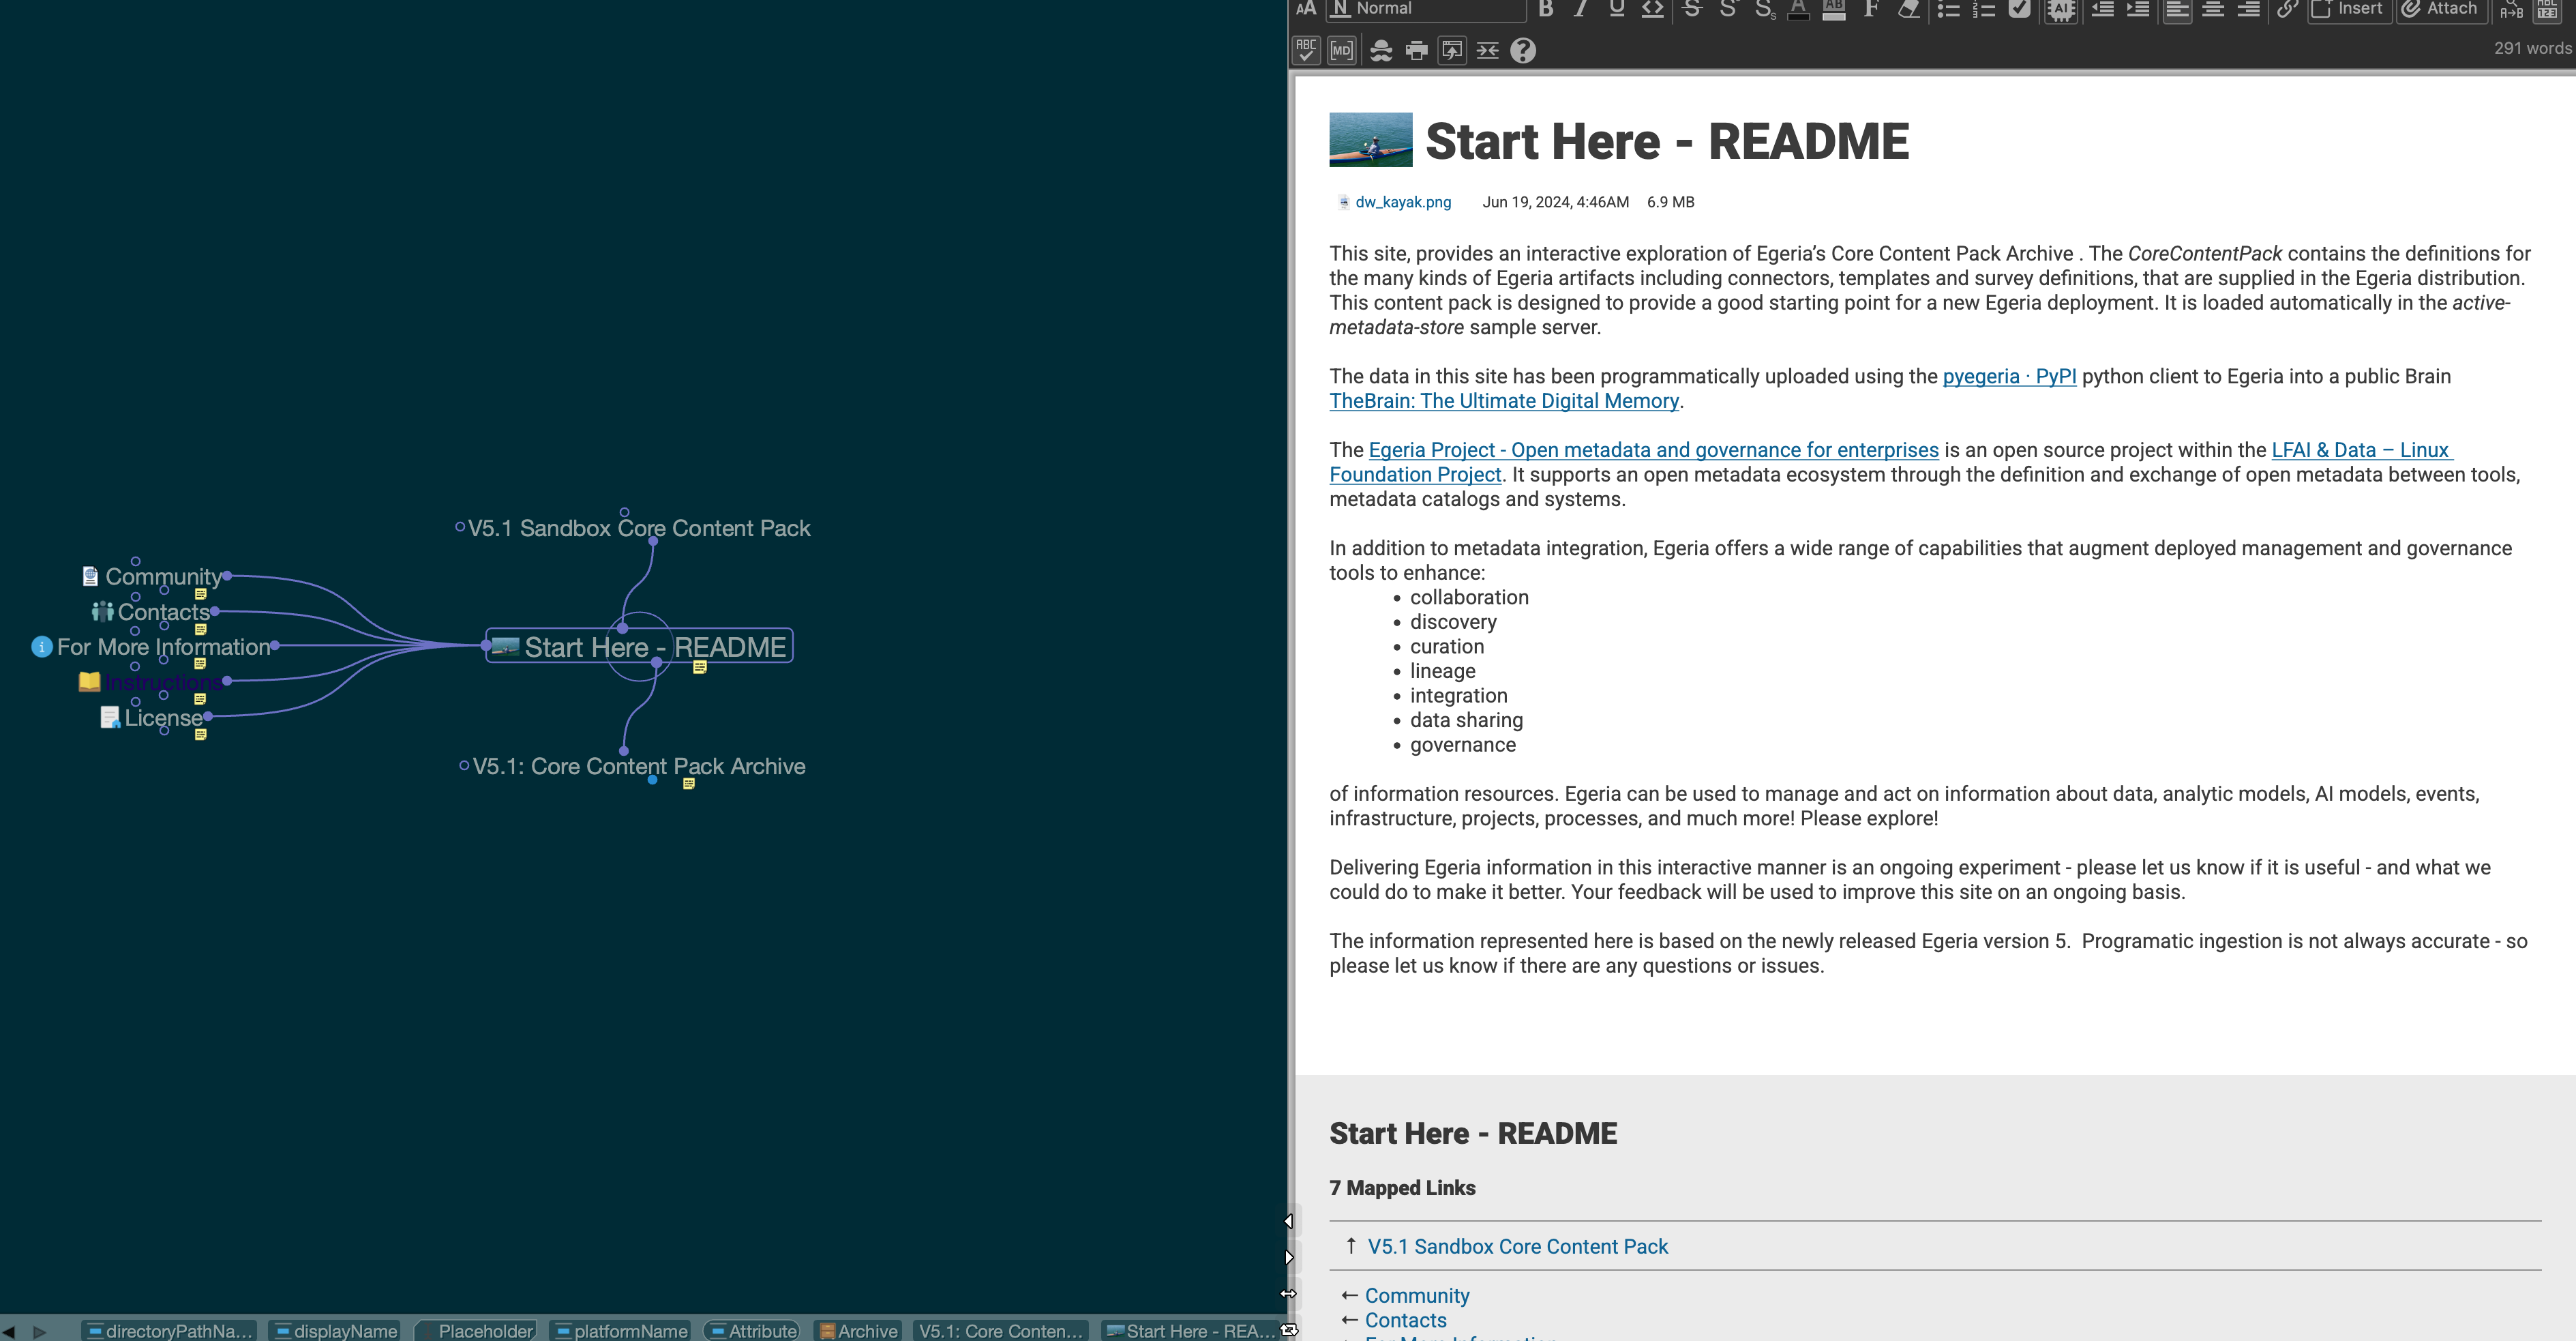
We essentially have three layers of integration capabilities:
Open Metadata Types
At the foundation are the Egeria Open Metadata types. The types define the kinds of information that Egeria can hold - and how these types relate to one another - and to Egeria's capabilities. There are a wealth of types that have been derived from numerous pre-existing standards and the communities experience. As the communities interests and requirements evolve, the Egeria community evolves Egeria to accomodate these changing needs.
Examples of the kinds of digital resources that are modeled by the Egeria Open Metadata types are documented at Digital Resources - however, as deployments of Egeria can be extended or tailored, the most accurate way to interrogate available types is by using the APIs to query your Egeria instance. The valid_metadata_omvs pyegeria module has methods to retrieve all the details. As the volume and complexity of the information returned can be somewhat overwhelming, we used these methods to create an experimental graph visualization that you can interactively navigate - Egeria Open Metadata Types - let us know what you think!
Integration Connectors
Integration connectors that provide specific integrations with technologies are the next layer up. New connectors will probably be added more often than new metadata types.. Integration connectors are written in JAVA and the runtime artifacts (JAR files) are loaded when Egeria starts. So one way to see what Connectors are available is to look in the directories on the Java CLASSPATH that Egeria uses. This is the second layer of integration artifacts.
CoreContent Pack
The final layer makes the integration information more visible and simpler to use for a broad range of people and automation to use by leveraging Egeria's native mechanisms to create and document reference data, templates, governance processes and other artifacts that are useful for integration and governance. These artifacts are aggregated into the CoreContentPack archive. We'll be spending more time on these in the next recipe.
A set of RESTful APIs and pyegeria methods allows us to inspect and use the CoreContentPack. These are, primarily in the Automated Curation python module.
Recap
There is more to discuss about cataloging assets than will fit in a single recipe - it is a topic that we will come back to time and again.
In this recipe we have started to explore Egeria's ability to directly catalog digital resources. Cataloged resources can be managed and governed. We can monitor assets over time to see how they change, and, perhaps if we gather enough information, how they are being used. It's important to recognize that when we talk about working with digital resources, we recognize that this could represent any kind of digital resource - Machine Learning Algorithms, Data Integrations, DevOps, Workflows, Organizations, etc.
Egeria can also integrate with other tools and metadata catalogs to exchange information. If another tool is already doing a good job in cataloging a class of resource, it may make more sense to connect Egeria and the other tool together than to create new Egeria connectors to connect to the resource. For example, the Egeria team recently released a connector to the new open source Unity Catalog. Unity Catalog focuses on technical metadata over a range of technologies and a natural partner to Egeria.